What is AQUA-DUCT?
AQUA-DUCT is a new tool facilitating analysis of the flow of solvent molecules in molecular dynamic simulations. AQUA-DUCT allows extraction, analysis and visualization of the behaviour of solvent molecules during the entire simulation. Such analysis can be useful for the analysis of the enzymes with a buried active site, connected with surrounding solvent by tunnels. The water flow can be controlled by molecular properties of amino acids constituting tunnels or in more sophisticated enzymes by gates controlling the opening and closing of the access pathways.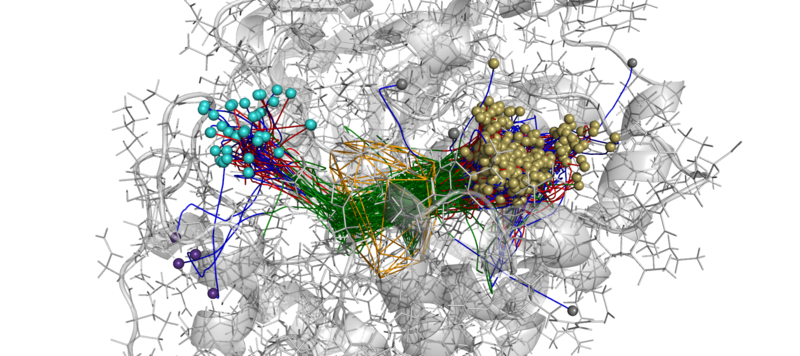
An example of AQUA-DUCT results.
Approximated trajectories of all water molecules detected in active site cavity during MD simulations of M. musculus epoxide hydrolase.
How does AQUA-DUCT work
AQUA-DUCT is perfectly capable of tracing molecules that enter defined region of the macromolecule during MD simulation. Detailed statistics and visualization of all traced molecules are available. Moreover, AQUA-DUCT performs clustering of exits/inlets data and groups identified paths according to this clusters – inlet-exit event grouping.
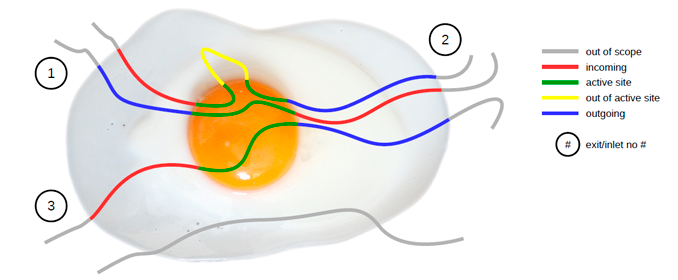
Following picture illustrates the concept behind AQUA-DUCT. Only molecules which flow through the active site are traced. Incoming, outgoing, and active site parts of paths are detected and visualized accordingly. Traced molecules form clusters which allow for further detailed analysis.
AQUA-DUCT performs calculations in 6 stages:
- Traceable residues
- Raw paths
- Separate paths
- Clustering of inlets
- Analysis
- Visualization
Following sections briefly explain these stages, detailed description can be found in the AQ documentation.
Traceable residues
In the first stage of calculation AQ finds all residues that should be traced and appends them to the list of traceable residues. It is done in a loop over all frames. In each frame residues of interest are searched and appended to the list but only if they are not already present on the list.
The search of the residues is done according to user provided definitions. Two requirements have to be met to append residue to the list:
- The residue has to be found according to the Object definition.
- The residue has to be within the Scope of interest.
The Object definition encompasses usually the active site of the protein. The Scope of interest defines, on the other hand, the boundaries in which residues are traced and is usually defined as protein.
Since AQUA-DUCT in its current version uses MDAnalysis Python module for reading, parsing and searching of MD trajectory data, definitions of Object and Scope have to be given as its Selection Commands.
Object definition
Object definition has to comprise of two elements:
- It has to define residues to trace.
- It has to define spatial boundaries of the Object site.
For example, proper Object definition could be following:
(resname WAT) and (sphzone 6.0 (resnum 99 or resnum 147))
It defines WAT as residues that should be traced and defines spatial constrains of the Object site as spherical zone within 6 Angstroms of the center of masses of residues with number 99 and 147.
Scope definition
Scope can be defined in two ways: as Object but with broader boundaries or as the convex hull of selected molecular object.
In the first case definition is very similar to Object and it has to follow the same limitations. For example, proper Scope definition could be following:
resname WAT around 2.0 protein
It consequently has to define WAT as residues of interest and defines spatial constrains: all WAT residues that are within 2 Angstroms of the protein.
If the Scope is defined as the convex hull of selected molecular object (which is recommended), the definition itself have to comprise of this molecular object only, for example protein. In that case the scope is interpreted as the interior of the convex hull of atoms from the definition. Therefore, traceable residues would be in the scope only if they are within the convex hull of atoms of protein.
Raw paths
The second stage of calculations uses the list of all traceable residues from the first stage and finds coordinates of center of masses for each residue in each frame. As in the first stage, it is done in a loop over all frames. For each residue in each frame AQUA-DUCT calculates or checks two things:
- Is the residue in the Scope (this is always calculated according to the Scope definition).
- Is the residue in the Object. This information is partially calculated in the first stage and can be reused in the second. However, it is also possible to recalculate this data according to the new Object definition.
For each of the traceable residues a special Path object is created. If the residue is in the Scope its center of mass is added to the appropriate Path object together with the information if it is in the Object or not.
Separate paths
The third stage uses collection of Path objects to create Separate Path objects. Each Path comprise data for one residue. It may happen that the residue enters and leaves the Scope and the Object many times over the entire MD. Each such an event is considered by AQUA-DUCT as a separate path.
Each separate path comprises of three parts:
- Incoming – Defined as a path that leads from the point in which residue enters the Scope and enters the object for the firs time.
- Object – Defined as a path that leads from the point in which residue enters the Object for the first time and leaves it for the last time.
- Outgoing – Defined as a path that leads from the point in which residue leaves the Object for the last lime and leaves the Scope.
It is also possible that incoming and/or outgoing part of the separate path is empty.
After the initial search of Separate Path objects it is possible to run special procedure, Auto Barber, which trims paths down to the approximated surface of the macromolecule or other molecular entity defined by the user.
Separate paths can be optionally smoothed. This can be done in two modes: soft and hard. In the former mode smoothed paths are used only for visualization purposes. In the latter, raw paths are replaced by smoothed. AQUA-DUCT implements several smoothing methods, including Savitzky-Golay filter.
Clustering of inlets
Each of the separate paths has beginning and end. If they are at the boundaries of the Scope they are considered as Inlets, i.e. points that mark where the traceable residues enters or leaves the Scope. Clusters of inlets, on the other hand, mark endings of tunnels or ways in the system which was simulated in the MD.
Clustering of inlets is performed in following steps:
-
Initial clustering: All inlets are submitted to selected clustering method and depending on the method and settings, some of the inlets might not be arranged to any cluster and are considered as outliers.
-
[Optional] Outliers detection: Arrangement of inlets to clusters is sometimes far from optimal. In this step, inlets that do not fit to cluster are detected and annotated as outliers. This step can be executed in two modes:
- Automatic mode: Inlet is considered to be an outlier if its distance from the centroid is greater then mean distance + 4 * standard deviation of all distances within the cluster.
- Defined threshold: Inlet is considered to be an outlier if its minimal distance from any other point in the cluster is greater then the threshold.
-
[Optional] Reclustering of outliers: It may happen that the outliers form actually clusters but it was not recognized in initial clustering. In this step clustering is executed for outliers only and found clusters are appended to the clusters identified in the first step. Rest of the inlets are marked as outliers.
At the end of clustering stage it is possible to run procedure for master path generation. First, separate paths are grouped according to clusters. Paths that begin and end in particular clusters are grouped together. Next, for each group a master path (i.e., average path) is generated.
Analysis
Fifth stage of AQUA-DUCT calculations analyses results calculated in stages 1 to 4. Results of the analysis are displayed on the screen or can be save to text file. Detailed description of analysis result file can be found in the AQ documentation.
Visualization
Sixth stage of AQUA-DUCT calculations visualizes results calculated in stages 1 to 4. Visualization is done with PyMOL. AQUA-DUCT automatically starts PyMOL and loads visualizations in to it. Molecule is loaded as PDB file. Other objects like Inlets clusters or paths are loaded as CGO objects.
The AQUA-DUCT development was supported by National Science Centre, Poland, DEC-2013/10/E/NZ1/00649
![]()